In March 2025, I was considering doing something:
Considering to expand and merge a couple of my drafts:
— aswin c (@chandanaveli) March 12, 2025
1. Draft titled "Design, analysis, and operations of my (internal) app" (Web apps, software engineering, browser automation, SAML, polling, animations)
2. Drafts about the internal server infrastructure I built for…
My work life has revolved around multiple different projects with multiple project titles, as I wanted it to be. So, this blog post will have a logbook-like format and is like a progress report. I just wanted to write this down before I forget all of this.
Table of contents
Internal tools at work
Maximus
Design, analysis, and operations
My first responsibility at work was to make an app—named Maximus—for a “bug dashboard report”. At the time of writing my previous work blog post, it was just a static web app which merged and filtered some CSV data and wrote it to an Excel workbook template. A lot of things such as getting those CSV files were still manual. This has changed. Maximus is now a full-stack single-click monster web app housing numerous mysteries that even I, its sole creator, often can’t unravel.
To an outsider, it may feel like Maximus has instrumental system design built in, but it’s just another app that grew along the timeline from a simple system that worked. Nevertheless, I see Maximus as both a hallmark and a monument of the first generation of useful software I built at a workplace, and also the first generation of homebrewed internal tools inside the global “premium support team” I’m part of at my work.
Let’s start with the function call graph of Maximus:
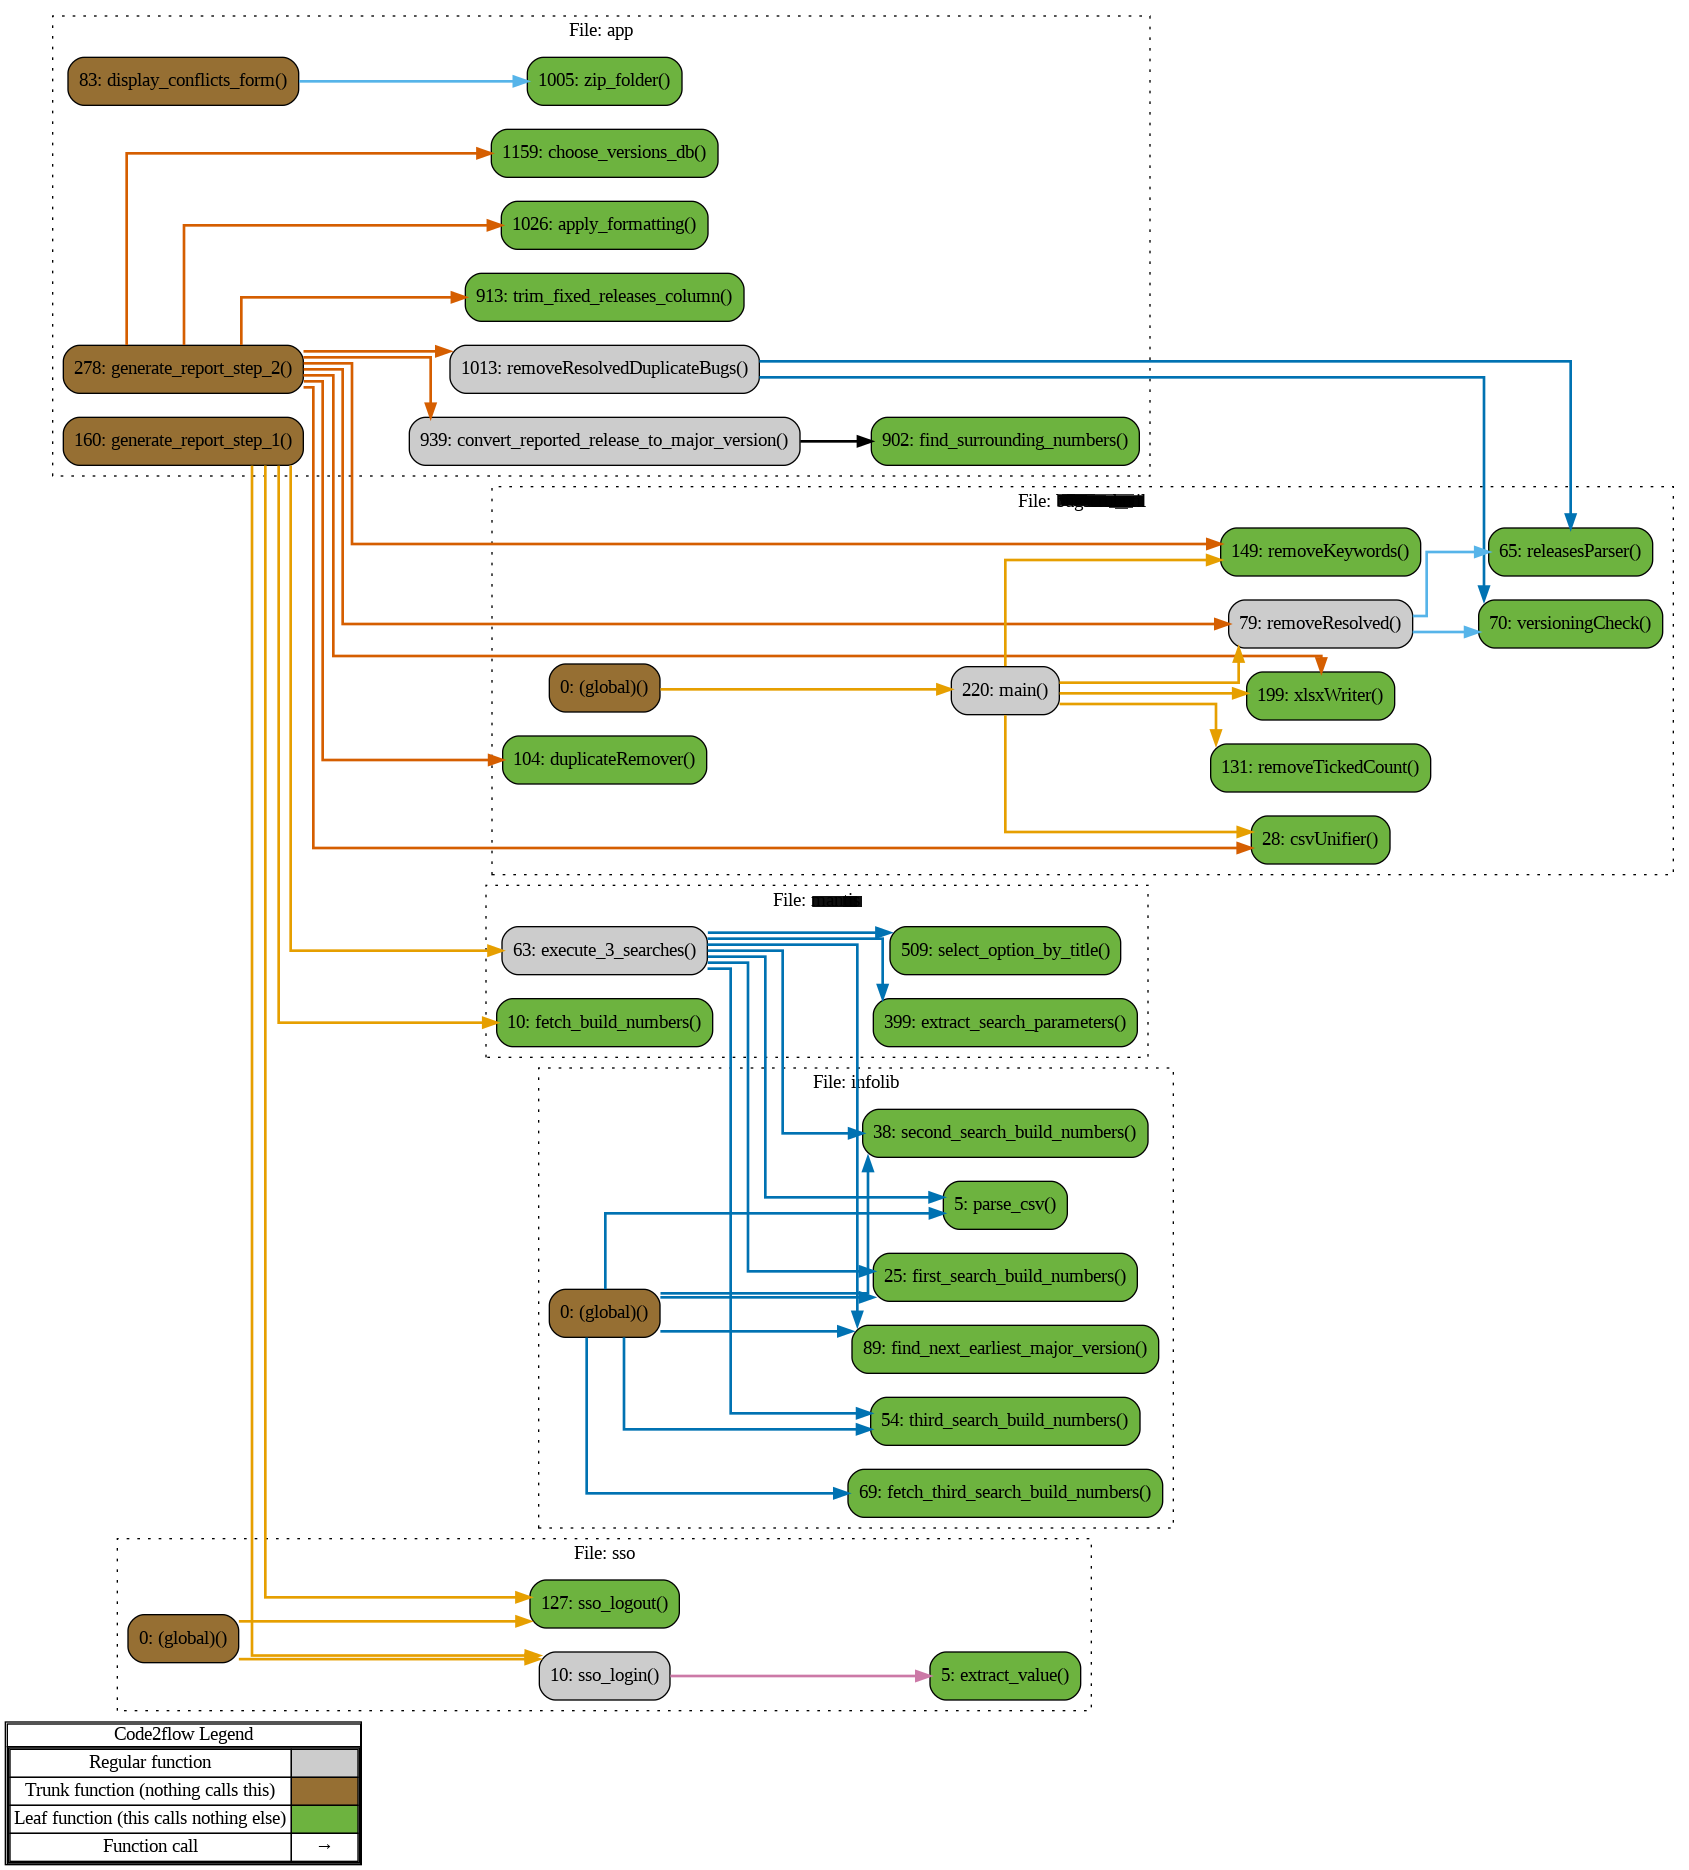
Notably, there are two things happening.
/generate_report_step_1() API receives the user input from the landing page. According to the input, it launches a few threads to fetch information from various places, such as our Engineering’s bug tracking tool, and a couple other teams’ APIs in parallel. Some normal SSO+REST API work and browser emulation had to be done here, since different teams across the company make different technology and strategy choices. Maximus also pulls from data warehouses that various operations teams rarely update, and finally displays a summary of what was fetched from various sources for the user to review.
/generate_report_step_2() API is all about optimization. A lot of clever and static algorithms such as removeResolved(), removeKeywords() work serially to finetune the information and remove bugs that are not relevant to the customer’s configuration of our product. This is the part where a lot of discussions and testing had to be done with team leaders worldwide, as optimization can never be perfect and a few bugs could always be missed. We now operate at around 40% shorter (more optimized) reports compared to the way this was done before, which translates to 5+ hours saved for the customer-facing engineer before they deliver it to the actual partner or customer. That’s probably a lot of lives saved, through the lens of Steve Jobs:
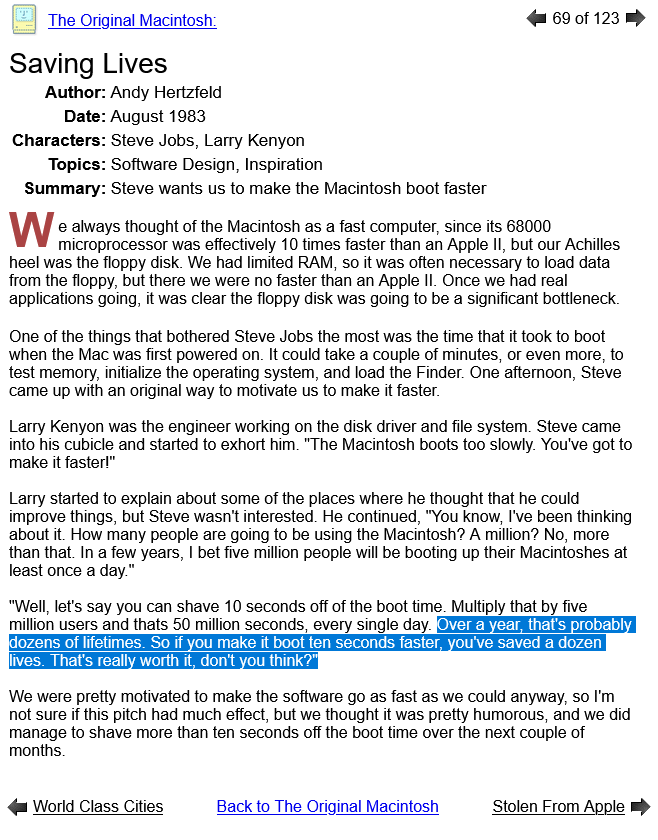
Link: https://folklore.org/Saving_Lives.html
After /display_conflicts_form() API lets the user choose whether or not to add some more information that was marked hot in the customer-facing-engineers’ collection of previous reports, the user gets to download the full report. A copy of the full report is pushed and stored in a folder in Sharepoint with some help from Microsoft Power Automate.
There’s check_progress() that’s doing some regular polling and serving some client-specific progress all the time. Right now, it’s just a function on the global scope.
Of course, cosmetic and report-template-specific incremental changes and improvements happen all the time. For example, we’re currently considering moving some information to another page and making a ‘key metrics’ sheet on the report for a top-level viewpoint. But as long as the deliverable doesn’t change drastically, the core software infrastructure of Maximus should likely stay the same. Therefore, I believe it might endure decades, as Stripe CEO Patrick Collison suggests when talking about a few “generational APIs” of his company:
"It's interesting that API design doesn't get more study as a discipline.
— Dwarkesh Patel (@dwarkesh_sp) February 20, 2024
When you get API architecture right, it can be so enduring over literally multiple decades.
Even in the face of frenzied evolutions in everything around it."
- @patrickc
Full episode tomorrow pic.twitter.com/KNREym0kRX
People and the team
Maximus has left me feeling like I delivered this project from 0→1: I’ve led it, scaled it, seen my “brilliant solutions” become tech debt, etc., not only technically but also strategically, such as in discovering the next step and plan, the people to talk to, the kind of impression the team should keep, etc. The responsibility was and is still heavy, as the correctness of the app and the report is business critical. But thankfully, we’ve made zero customer-critical errors so far. And for the past 12+ months, this has just worked.
this is also a big mindset shift that researchers coming into swe have to experience. in research, you do a bunch of stuff and then ship a static, complete artifact — the research paper (+ code). you move on.
— Linus (@thesephist) February 17, 2025
in SWE you ship the living system and you have to keep it alive
On the process side, my teammate has worked on various new ways of delivering this report differently based on periodicity, incrementalism, and consolidation. It is still interesting to see how an actual deliverable is eventually born from discussions and narratives that start from a random afternoon conversation.
Personally, I feel I undervalue the impact of this thing: the report might be sitting on the desks of executives at major global companies, world’s chip manufacturers, top banks, and many other places where a lot of other important decisions are made. The report Maximus churns out costs significantly more than your wildest guess and my company makes a lot of money with this. And, according to the data, the premium customers mostly buy it 3-4 times a year and we’re sending out ~4.3 reports a business day. B2B SaaS is unreal and still where a lot of the money is.
Service Reporting tool
The quarterly service report—a slide deck with a bunch of customer-specific metrics like usage trends, money spent, etc—was something assigned to the team I’m in to own and operate since mid 2024, as the guy who used to run it since the global umbrella team’s inception retired and probably moved to someplace closer to the Mediterranean. Moreover, everyone knew it was centralized, used a very old tech stack, and was quite unmaintainable.
Since we couldn’t change how the final deck looks, we couldn’t move away from Microsoft. Therefore, the tech stack of this thing is a bit old school: Microsoft Excel, VBA (Visual Basic for Applications) and Power Query. And the pipeline goes something like: fetch data from Tableau using Tableau API Excel Macros, filter and process using Power Query, use the pivot charts and tables to draw the charts, and finally use Macros again to copy them into the report slide template—all on the user-side.
Here, I built the slide generation part of the project—the part where the charts and tables are copied to the slide template. I had to come up with a few clever checks to deal with blank slides, blank tables, small tables, etc., all of which have merrily worked well for all our global engineers and managers for the past 2 quarters.
Later in Q2 2024, I built a sort of “server version” which generates these reports for all customers. This was a pipeline that fetches data from Tableau, writes it to an sqlite database, fills the Microsoft Excel template, and triggers the VBA code which refreshes the Power Queries and charts. Xlwings was the Python library at the heart of this pipeline—a library built on top of Win32 APIs—which let me interact with Excel Macros through Python. This hasn’t been used in production for its intended use, but the database was found to have another use - to act as a performant source for some dashboarding and analytics, which worked well and reached the Vice President’s slide deck on the recent leadership summit.
People and the team
The best part of this was working with a senior engineer from the U.S, who sits on top of years of organizational knowledge and raw tinkering skill. I saw how shipping (software) by itself is a signal—on how you just ship the software, see how people react, and lead it from there, rather than wait for a general consensus, gather too many opinions, or get stuck in your own head.
I still think the team is extremely lean: we’re just a team of one 10x engineer (mentioned above), two 1-x engineers (me and my co-worker from Bangalore), a relationship manager (who talks to the wider team, gathers information, seldom takes “executive decisions”), and a program manager (rationalist, bureaucrat) to send the right e-mails and defend against the dark arts. It’s a joy to be able to execute well and fast. It was fun to walk around one day, and see a couple of folks using the tool and getting their report generated on their screen. The feeling of seeing something you made running in the wild never gets old.
B2B stuff at work
There’s no one way to make sure a software upgrade of network devices such as firewalls went well—there are many. Some folks just want a tool to fetch a lot of data from their firewalls (one of our products) and put it in an Excel file so that they can easily see whether something needs more attention. That’s something I did. Writing to an Excel file was obviously with openpyxl – the best Python framework for working with Excel files. Later, I “vibecoded” a pretty cool comparison algorithm which could compare two versions of such Excel reports and display the changes (which can be filtered) that you should focus on.
The world doesn't know the extent to which I've used and abused openpyxl internally at my workplace. At this point, I should contribute upstream and free myself from the technical karma of silent mercenary consumption.
— aswin c (@chandanaveli) March 6, 2025
The journey of delivering this tool for this customer was excellent because they knew exactly what they wanted. The customer-facing technical engineer who directed me and led the conversations was also quite talented and helpful, so I ended up nominating her for that quarter’s Best Co-worker Award Thingy.
At the end, the customer tested it in a couple of their clusters in a great city near the Taiwan Strait, was happy, and we got the signoff. A ton of money was added to the company’s APAC revenue.
A couple of other small tools to assist in testing High Availability cluster failovers, optimizing firewall policies (like, remove zero-hit policies) that work standalone and work with customers’ existing automation pipelines were built and delivered as well. I just don’t want to talk too much here about that.
Side projects
tweetlists.app
I wanted to make an app that allows me to create a shareable list of tweets. You can see the Lists I’ve made public at my TweetLists profile.
It all started with a simple Tweet renderer React component—my the initial idea.
<RenderTweets
  tweetIds={"12345678901234567890, 12345678901234567890, 12345678901234567890"}
/>
I just poured abstractions on top of each other, such as the functionality to store Tweet ID lists in a database, users and OAuth, profiles, etc. This is my first full-stack app and I’m happy to have a few users (5-7 signups and many anonymous users) for it.
For a long time, I was thinking "there's gotta be a better way to share a bunch of tweets together", so I made https://t.co/PVkYvEcoe3.
— aswin c (@chandanaveli) May 2, 2025
It was kind of fun to hack this together, so check it out: pic.twitter.com/olkiKTOtkR
I know I need to share this with more people and market it better. I know more Twitter “threadbois” would love to use this.
tiles.run
Watching Claude Artifacts render a React application on the client-side for me was a realization that the idea of instant reusable software could be interfaced in a different way. This was one of the ideas feynon had too, but combined with many other things. So, we started building.
Currently, Tiles is a notebook - an AI-first Notion-like notebook with MCP and agents built-in. For local and client-side use, it can use MCP servers from mcp.run—which are also WebAssembly modules—and runs it locally or on the server-side. Or it can connect to remote MCP servers, such as Asana’s with OAuth and interact with it. Through this came a library and a tool: mcp-client-toolkit and mcp-cli.
I learnt a lot about the web, AI, agents, MCP, and what it’s like to be on the frontier of an evolving technology through this.
Tiles is something, but it’s not a product at all right now. But it sure is a signal.
Not to ambush @_feynon or put him on blast, but of things of note I'm absolutely making a clone of and people should check out is tiles dot run and tilekit - who knows if it's ready, but very strong Mikupad vibes. pic.twitter.com/MV8rNL1Fxu
— gerred (@devgerred) June 9, 2025
Future
There is no greater professional joy than putting my own fingerprints in a product, and for that product to find people willing to use and sometimes also trade their hard-earned money. The final product is my story in the bigger story, and this is why I think I want to work more on the consumer side – because it’s cool, and also as it involves so much strategy and engineering.
Some closing future-related thoughts:
- Every 8-10 months you learn a bit more about the world, and I understand the world and culture a bit more. In random subtle moments, such as while coming back to the city from parent’s home, on an afternoon walk, I suddenly feel a tiny bit more mature. After all, two years is enough time to start seeing things differently. Ultimately, I see a better chance of making things that are even more useful.
- Power is an incredible entity and it makes people and systems behave a certain way. A lot of power is invisible and rests in the shadows, and hence I feel it’s a miracle that anything gets done in a company (reminds me of the quote “solve cooperation and use that to solve everything else). I think understanding this helps you recalibrate on what to focus on. I also mean this in the realm of the whole world, where it is clearly run by a few people and few companies. Disruptions may come from small places, but might be acquired by larger competitors, as a competitor with distribution, data, network/scale effects, or brand could stay more relevant than your product even if your product is 10x better. To rise, one needs to be political as well.
- Reality is built of atoms and bits, and they’re shaped by people. We sometimes construct our reality based on words they’ve read, but these words might not reflect the actual reality. I have to always try to get closer to the ground reality - by asking the right questions, trying more than one things, etc.
- Generally speaking, in most ways, it’s a glorious future for generally smart, question-asking, action-oriented people since they’ll have all kinds of AI by their side. There is much more room to focus on things that don’t scale.
Generally speaking, in most ways, it's a _glorious_ future for generally smart, question-asking, action-oriented people since they'll have all kinds of AI by their side. So much acceleration. Glorious.
— aswin c (@chandanaveli) April 14, 2025